
Bitcoin volatility
Bitcoin volatility describes how strongly the price of bitcoin fluctuates over a specified period. Realized volatility measures past price changes, while implied volatility reflects the expectations contained in options prices. The measurement period and calculation method matter when comparing bitcoin with shares, gold or another investment.
Investors use volatility to assess how much a bitcoin position might change the risk of a portfolio. Larger price fluctuations can lead to substantial losses over short periods and affect the capital needed to support a position. A comparison with other assets needs consistent measurements and consideration of how their prices move together.
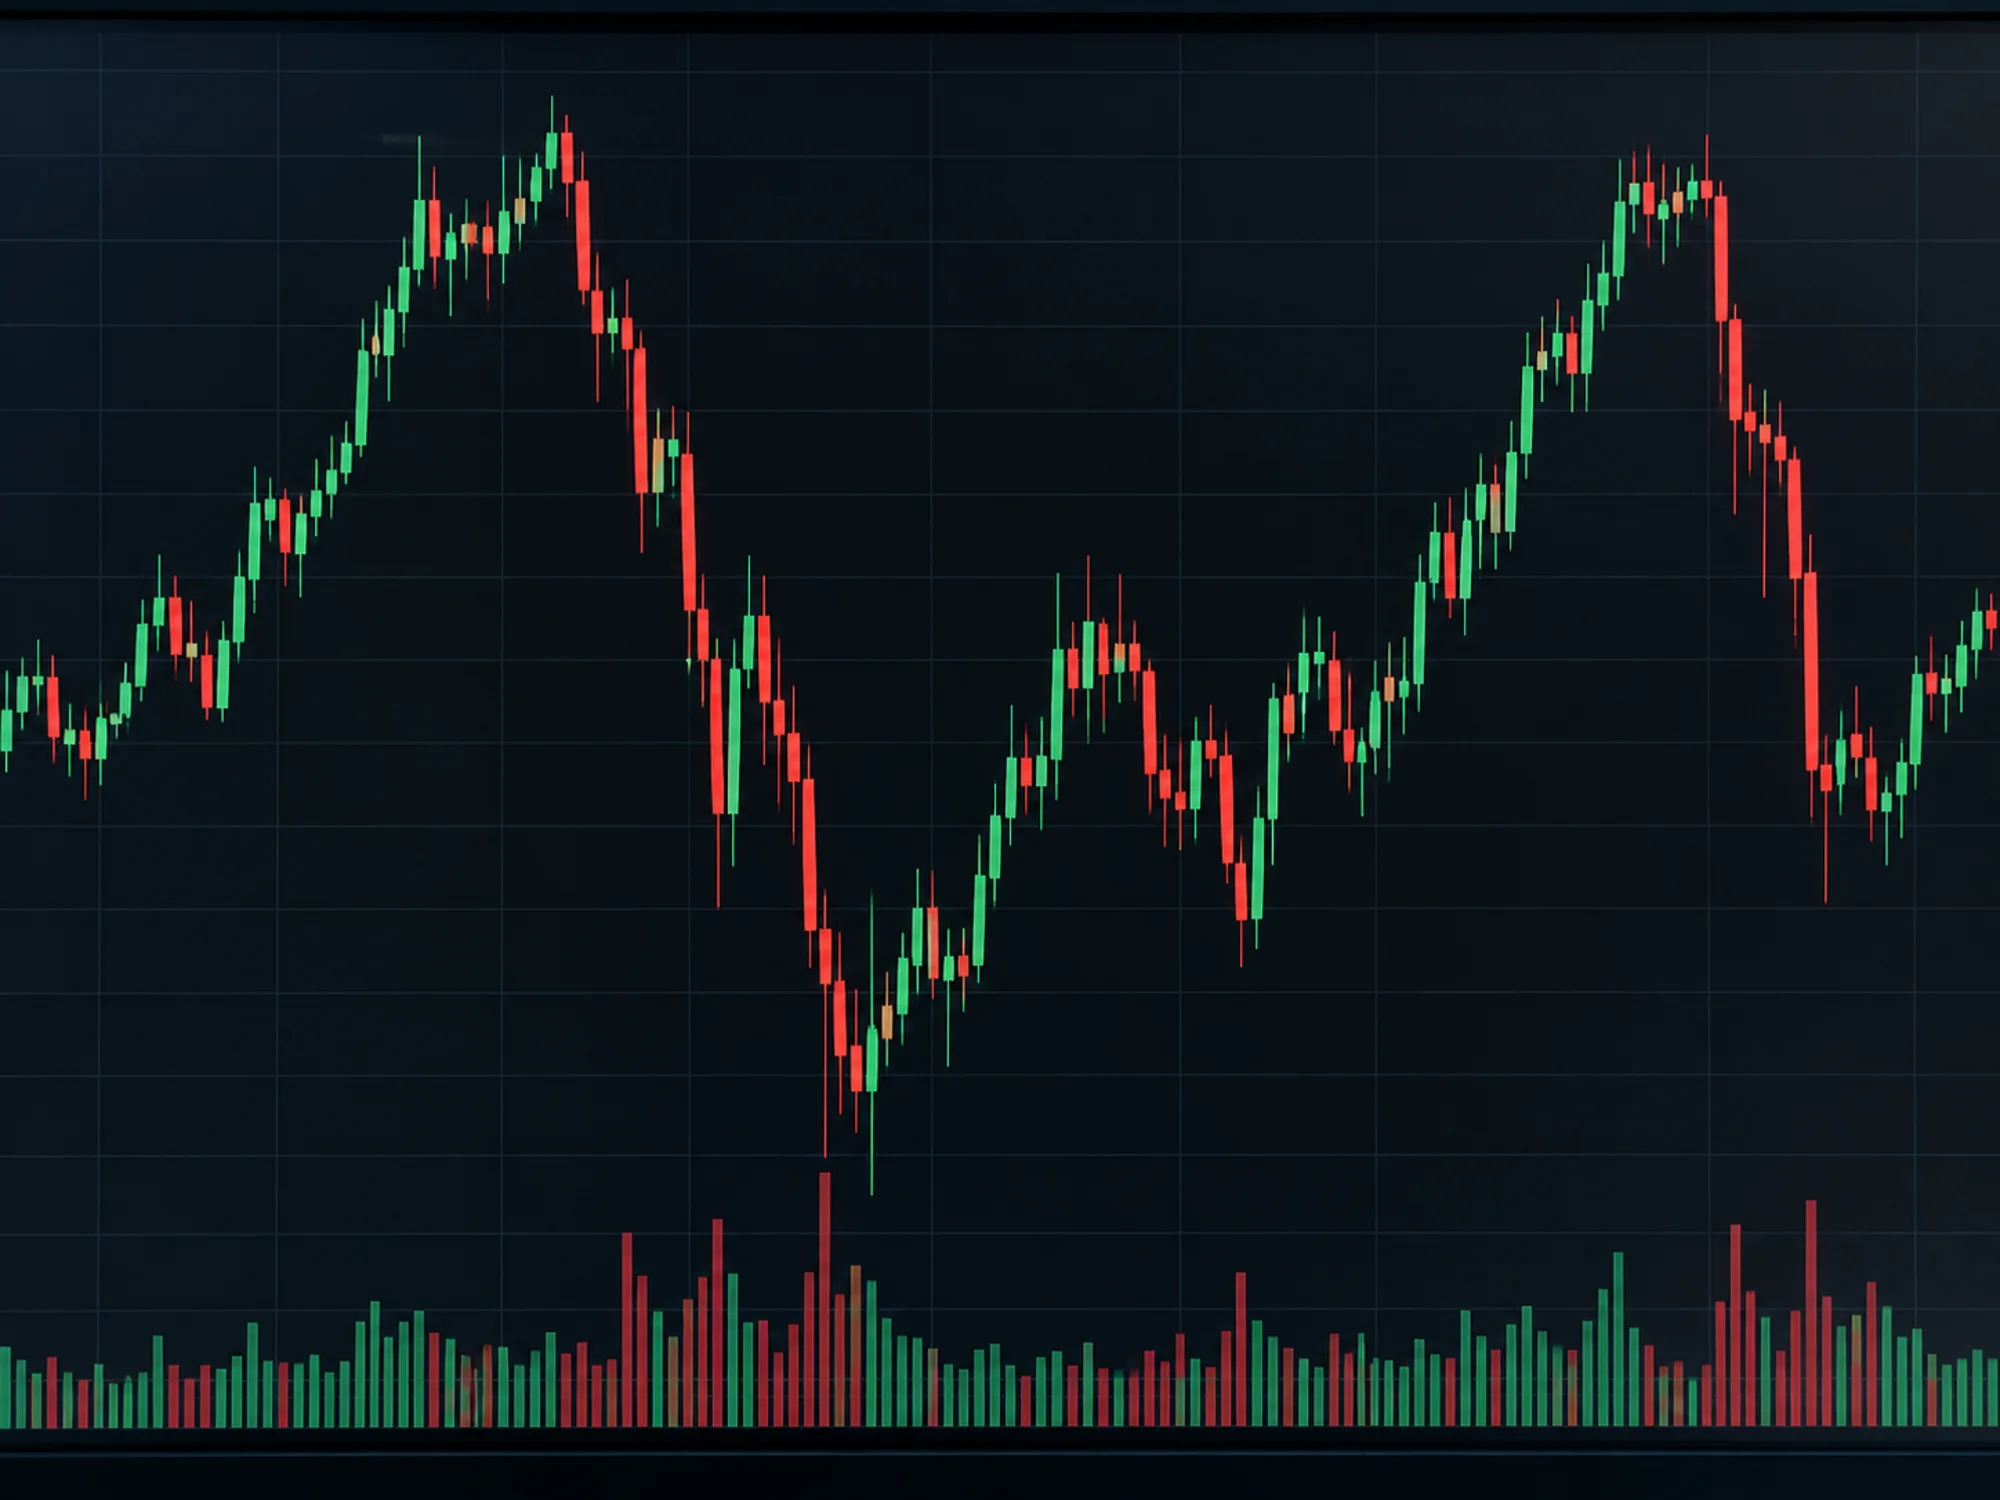
Realized against implied volatility
Realized volatility takes the daily returns over a window, usually 30, 60 or 90 days, computes their standard deviation and scales it to a year, so a single number describes how much the price actually moved. Implied volatility looks forward and comes out of option prices: it is the volatility the market must be assuming for those options to be worth what they cost.
Two published indices track the implied figure for bitcoin. DVOL from Deribit has a normal range around 50 to 65 percent and printed as low as 36 percent in May 2026. BVIV from Volmex reached close to 100 percent during the FTX collapse in November 2022. Implied has usually sat above realized, which is the volatility risk premium an option seller earns, and the gap is itself a traded quantity.
How the measure compares with equities and gold
Over a ten-year window bitcoin's annualized volatility has averaged around 46 percent, against roughly 9.6 percent for the S&P 500 and about 8.7 percent for gold, so roughly five times an equity index and five times gold, as a tracker of bitcoin volatility data compiles from published sources.
The single-stock comparison is the more useful one for a portfolio discussion. Over the same ten-year window Tesla averaged about 32 percent and Nvidia about 28 percent, and in 2024 bitcoin's 12-month figure of roughly 35 percent sat in the same region as both. An asset class five times an index is unusual; a position comparable to a large technology stock is something a mandate already knows how to size.
Why the level changed with ETP and treasury demand
Annualized volatility ran above 180 percent in 2013, around 150 percent at peaks in 2017, above 60 percent in 2020 and around 35 percent in 2024, with 2025 readings as low as the low twenties. The mechanism is the holder base: a market whose marginal buyer is a leveraged trader moves more than one whose marginal buyer is a fund rebalancing a percentage weight.
Two demand sources did most of that work. Exchange-traded products took in tens of billions of dollars and now hold coins that do not trade day to day, and listed treasury companies issue equity to buy coins they intend to keep, which is described on digital asset treasury companies. By early 2026 roughly 12 percent of the supply sat with those two groups, which removes it from the float that sets the price.
What a volatility number does to a risk limit
Bitcoin volatility flows straight into the position size. A value-at-risk model multiplies the position by the volatility and a confidence factor, so a holding five times as volatile as an equity consumes five times the limit per euro invested. That arithmetic is why institutional allocations come out at a few percent, and the method is worked through on crypto portfolio allocation.
The falling trend has a second consequence inside the model. A value-at-risk figure calibrated on a 30-day window will understate the risk going into a turbulent period and overstate it coming out, because volatility arrives in clusters. Risk teams answer that with a stressed scenario alongside the model figure, and the full taxonomy is on digital asset risk management.
Drawdowns: the number behind the volatility
Volatility describes the average day; a drawdown describes the worst sequence. Bitcoin's record contains a fall of about 94 percent over 163 days in 2011, about 86 percent over 410 days from 2013, about 84 percent over 363 days from 2017, and about 78 percent over 376 days from 2021. In March 2020 it fell roughly 52 percent within 48 hours.
The recovery period matters as much as the depth, because a position that takes hundreds of days to recover cannot fund a near-term liability. Equity comparisons exist for context: Tesla fell about 48 percent and Nvidia about 37 percent in 2025, which are large numbers for single stocks and small against bitcoin's history.
Volatility clustering around macro events
Crypto trades every hour of the year, and macro data does not. A central bank decision or an inflation print lands while equity markets are closed, and bitcoin absorbs the whole reaction in one move instead of spreading it across a session. That is one reason its correlation with equities rises in stressed weeks: it has become one of the instruments through which a macro surprise is expressed first.
Option markets price this in advance, which is why implied volatility rises ahead of a scheduled event and falls after it. A desk trading the gap between implied and realized volatility is doing so through the instruments described on crypto derivatives.
Where the data comes from
Bitcoin volatility data comes from four source types, each with limitations. Spot price histories come from exchanges and from index administrators registered under the EU Benchmarks Regulation, and the choice of venues changes the result at the margin. Implied volatility comes from the option venues themselves, Deribit and CME being the largest by open interest, and from the index providers who publish DVOL and BVIV. Research houses publish comparison tables. And crypto market data describes the provider landscape and the MiCA rules on it.
Two numbers that look identical can differ by several percentage points because of the window, the sampling frequency and whether returns are logarithmic or simple. Anyone quoting a volatility figure in a committee paper states the window and the source alongside it.
Is bitcoin's volatility falling for good?
The trend has held for over a decade and nothing guarantees it continues. The mechanism behind it, a larger share of supply held by investors who do not trade it daily, is still running, and six-month realized volatility reached record lows in 2025 with bitcoin at roughly twice gold's volatility, the narrowest gap recorded. A liquidity shock can reverse that in a week, because the float that sets the price is smaller than it used to be, and a smaller float moves further on the same order.
Can you invest in bitcoin volatility itself?
Investors can trade bitcoin volatility through options and volatility futures. An option position gains when realized volatility exceeds what was implied at purchase, and futures on a volatility index let a desk take a direct view on the level. Both are derivatives, both require margin, and both are financial instruments under MiFID II in the EU instead of crypto-assets under MiCA. A long volatility position also decays while nothing happens, which is the cost of holding insurance.
Bitcoin volatility and Finance Loop
Finance Loop is the meeting place for the risk managers, treasurers and portfolio managers who have to turn this number into a limit. Finance Loop events on digital assets put volatility measurement, value-at-risk treatment and the derivatives used to hedge it on one agenda, and the subject belongs to the track Investment & Digital Assets.
Finance Loop connects the finance, IT and AI communities, so a risk officer calibrating a crypto limit meets the data providers and the trading desks at Finance Loop events.
Finance Loop is a professional network supporting the institutional use of emerging technologies in finance, such as AI, tokenization, stablecoins, and DeFi. Finance Loop helps its members build skills and personal networks in these fields: Investment & Digital Assets, Payments & Digital Money, Digital Infrastructure & Sovereignty, and Risk & Compliance.